# Docker Hub
docker run -d \
  --name qdrant-exporter \
  -p 9153:9153 \
  -e QDRANT_EXPORTER_QDRANT__NODES='[{"url":"http://host.docker.internal:6333"}]' \
  --add-host host.docker.internal:host-gateway \
  baselhusam/qdrant-exporter

# GHCR
docker run -d \
  --name qdrant-exporter \
  -p 9153:9153 \
  -e QDRANT_EXPORTER_QDRANT__NODES='[{"url":"http://host.docker.internal:6333"}]' \
  --add-host host.docker.internal:host-gateway \
  ghcr.io/baselhusam/qdrant-exporter
Prometheus scrape target: http://<host>:9153/metrics — add to your existing Prometheus config.
services:
  qdrant-exporter:
    image: baselhusam/qdrant-exporter
    restart: unless-stopped
    ports: ["9153:9153"]
    environment:
      QDRANT_EXPORTER_QDRANT__NODES: '[{"url":"http://host.docker.internal:6333"}]'
    extra_hosts: ["host.docker.internal:host-gateway"]

  prometheus:
    image: prom/prometheus:latest
    restart: unless-stopped
    ports: ["9090:9090"]
    volumes:
      - ./deploy/prometheus.yml:/etc/prometheus/prometheus.yml:ro
    extra_hosts: ["host.docker.internal:host-gateway"]

  grafana:
    image: grafana/grafana:latest
    restart: unless-stopped
    ports: ["3000:3000"]
    environment:
      GF_SECURITY_ADMIN_USER: admin
      GF_SECURITY_ADMIN_PASSWORD: admin
    volumes:
      - ./deploy/grafana/provisioning:/etc/grafana/provisioning:ro
      - ./dashboards:/etc/grafana/provisioning/dashboards:ro
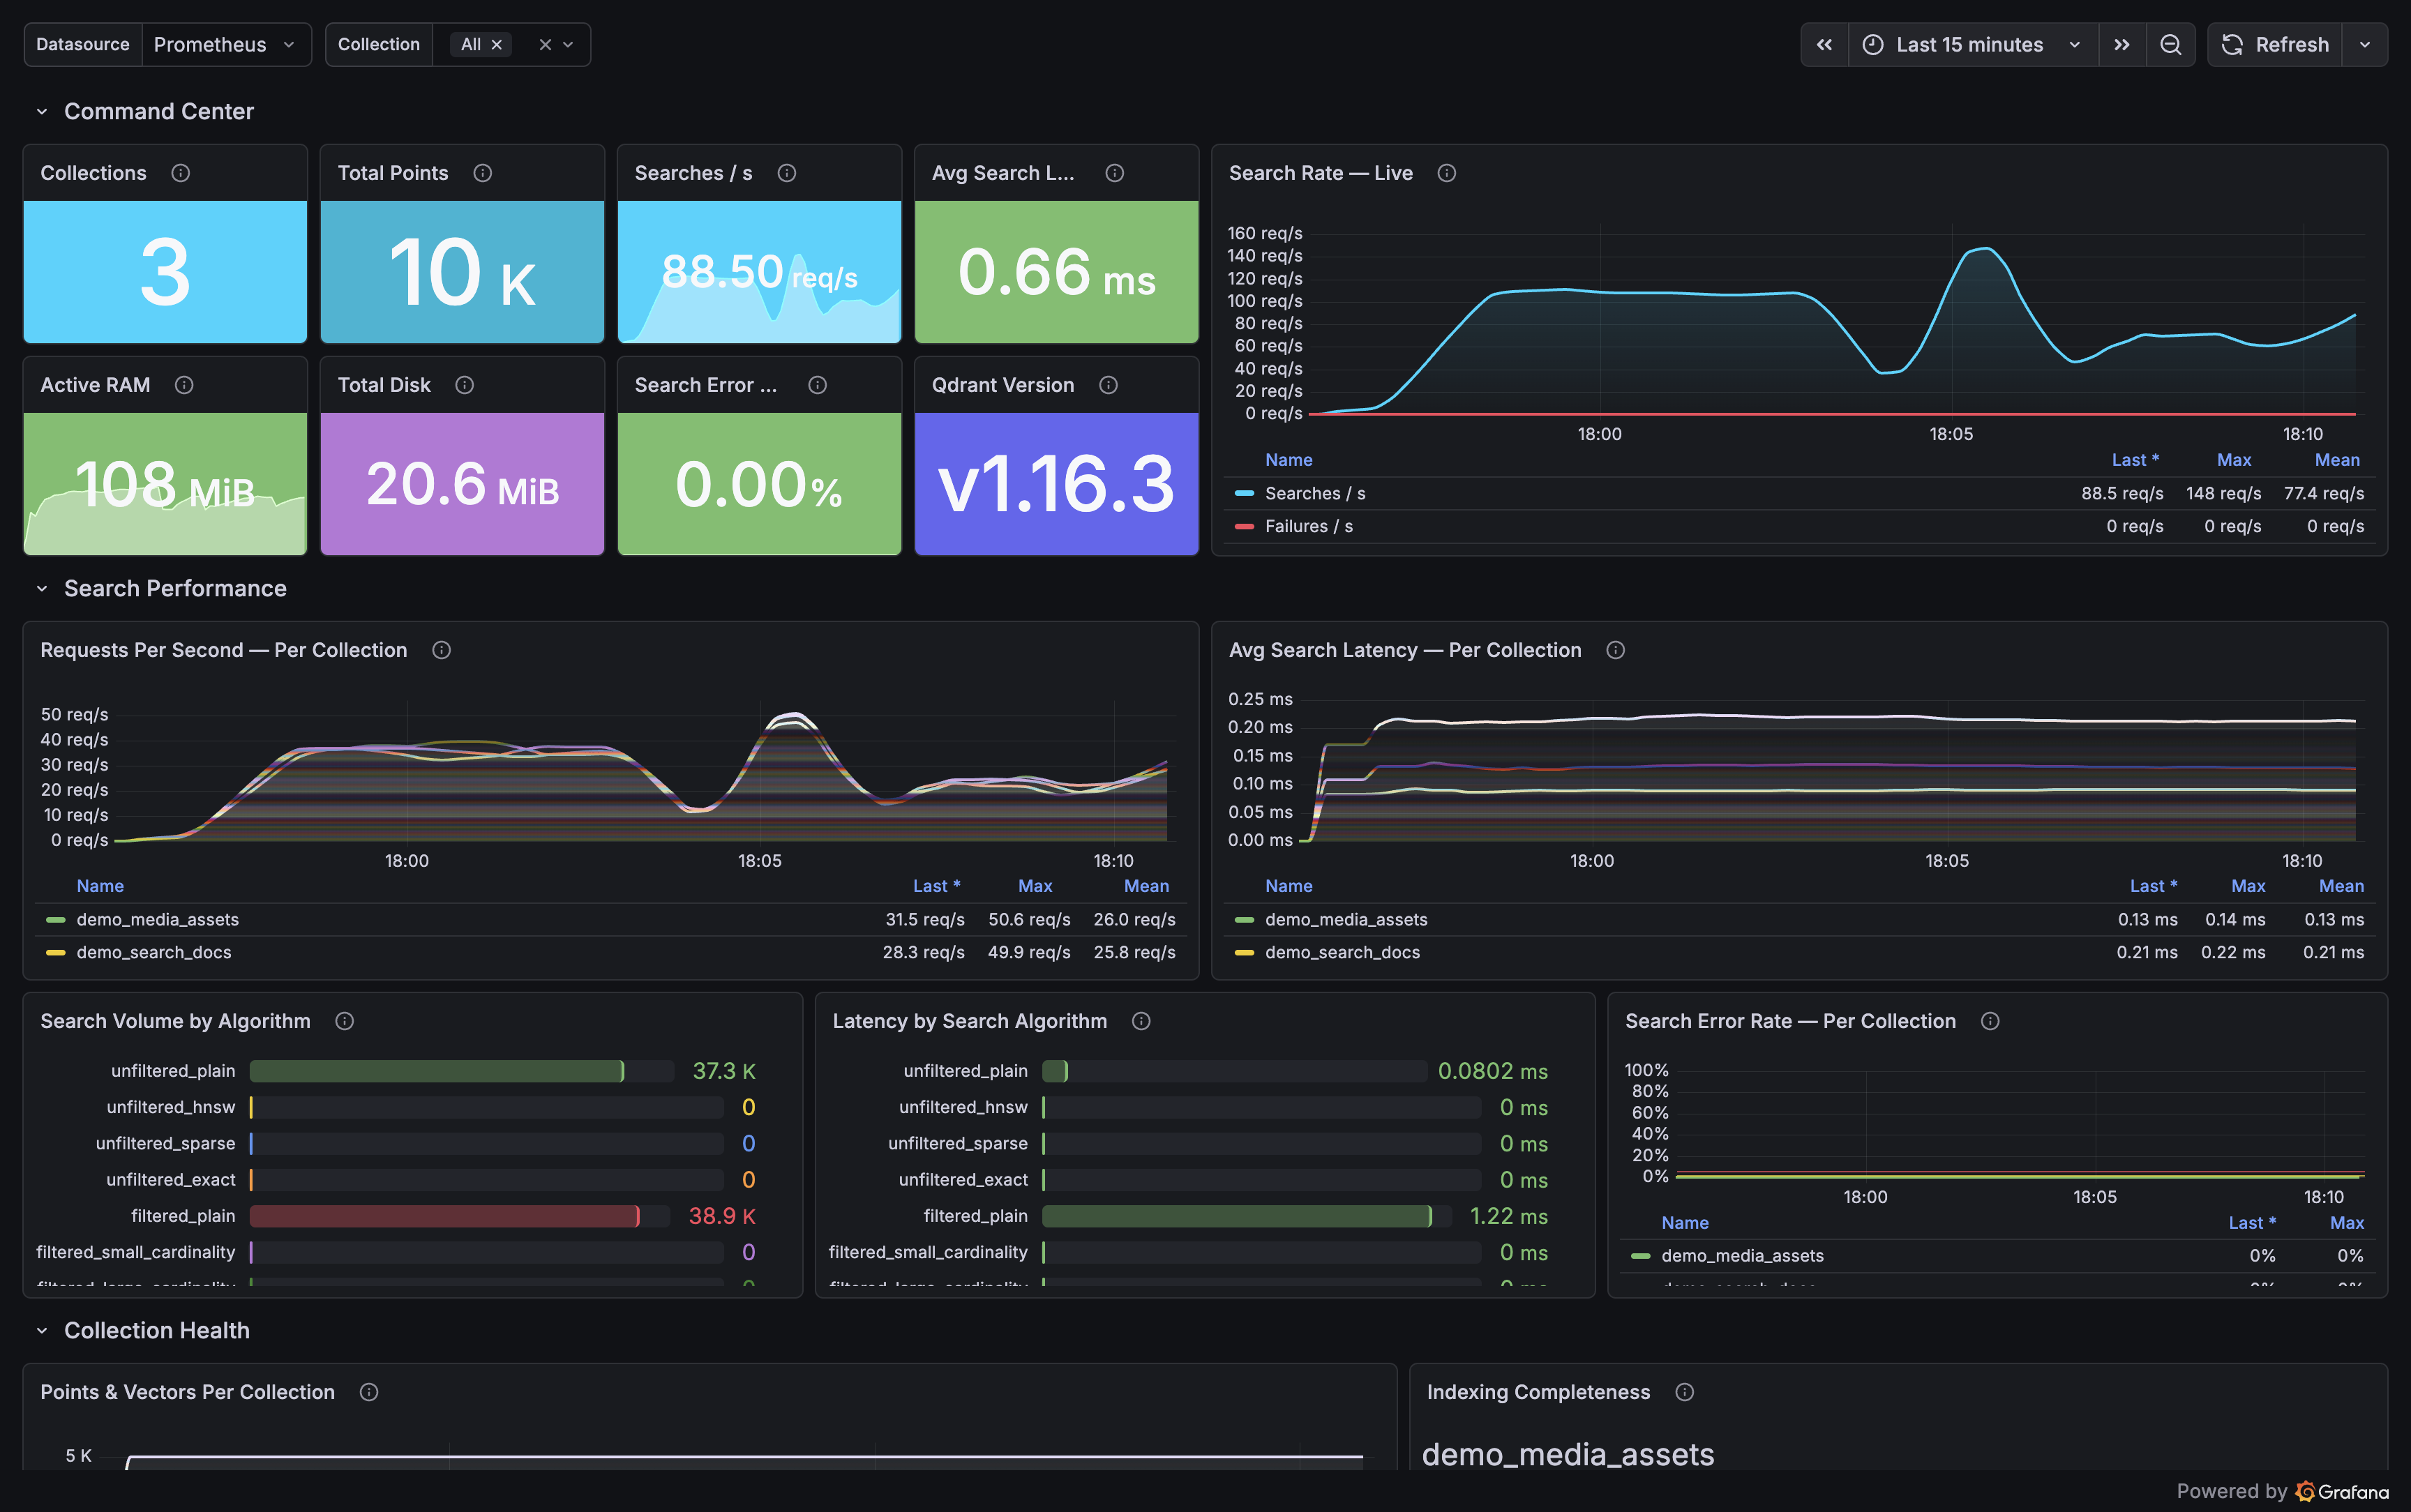
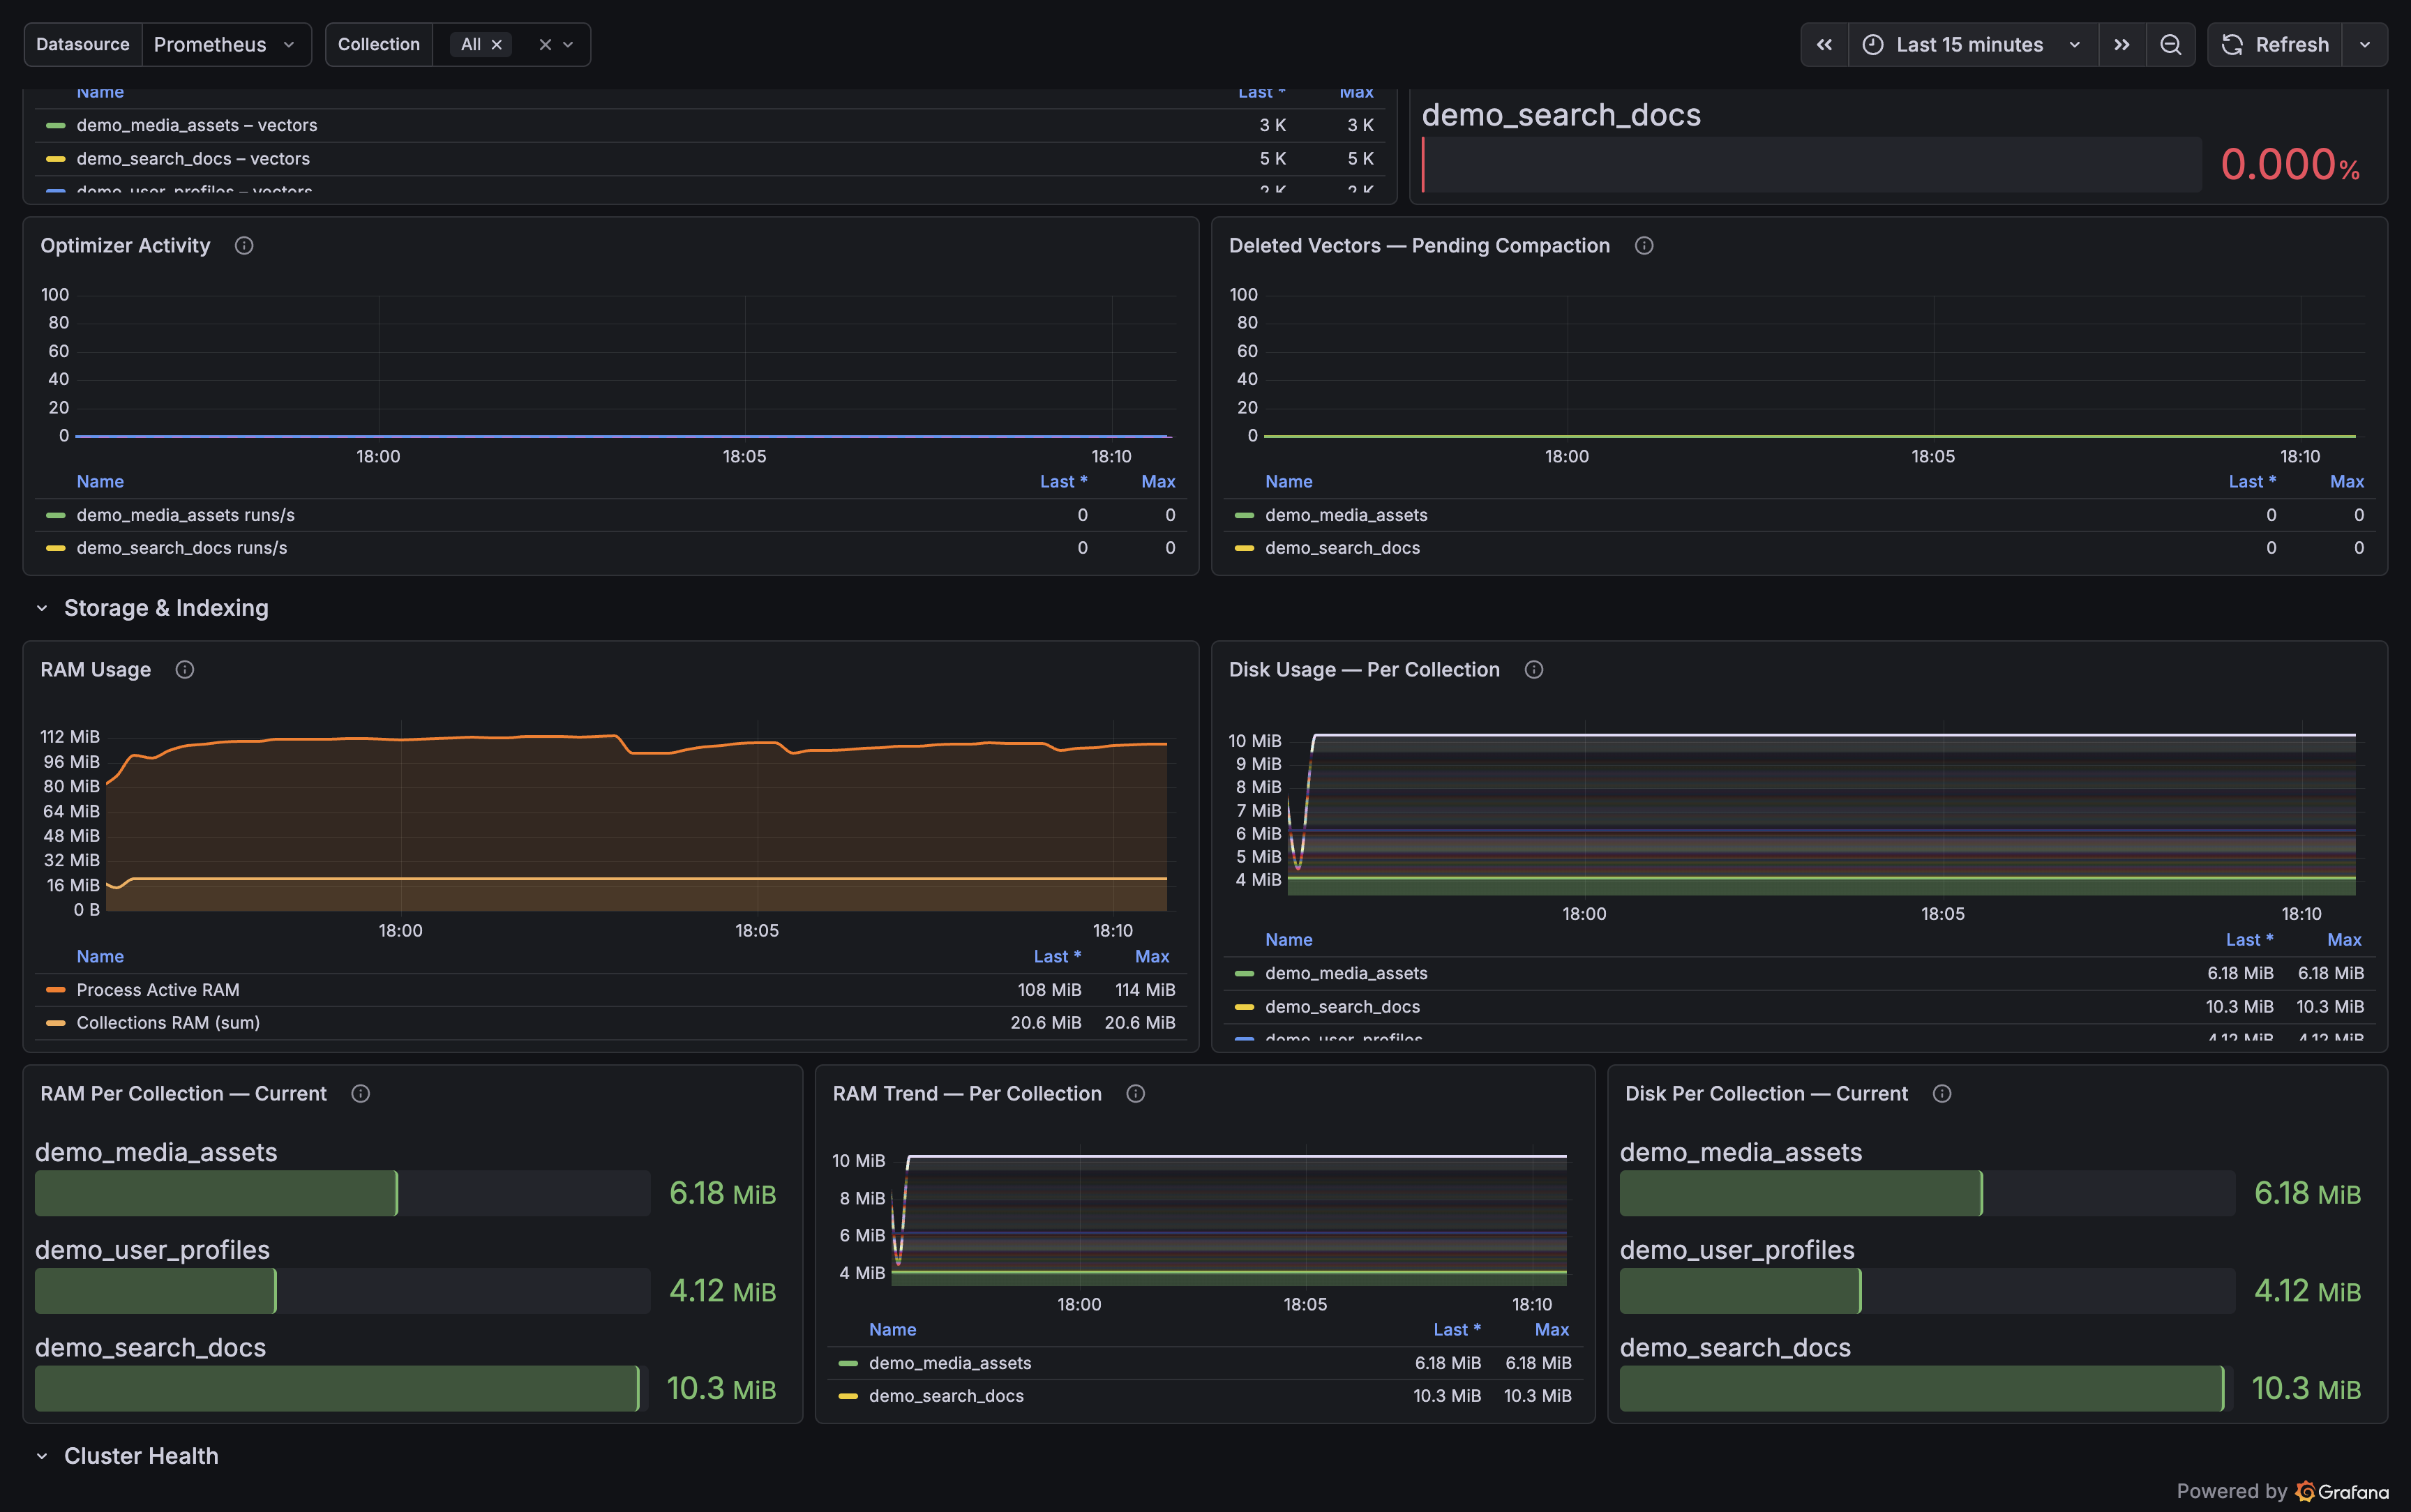
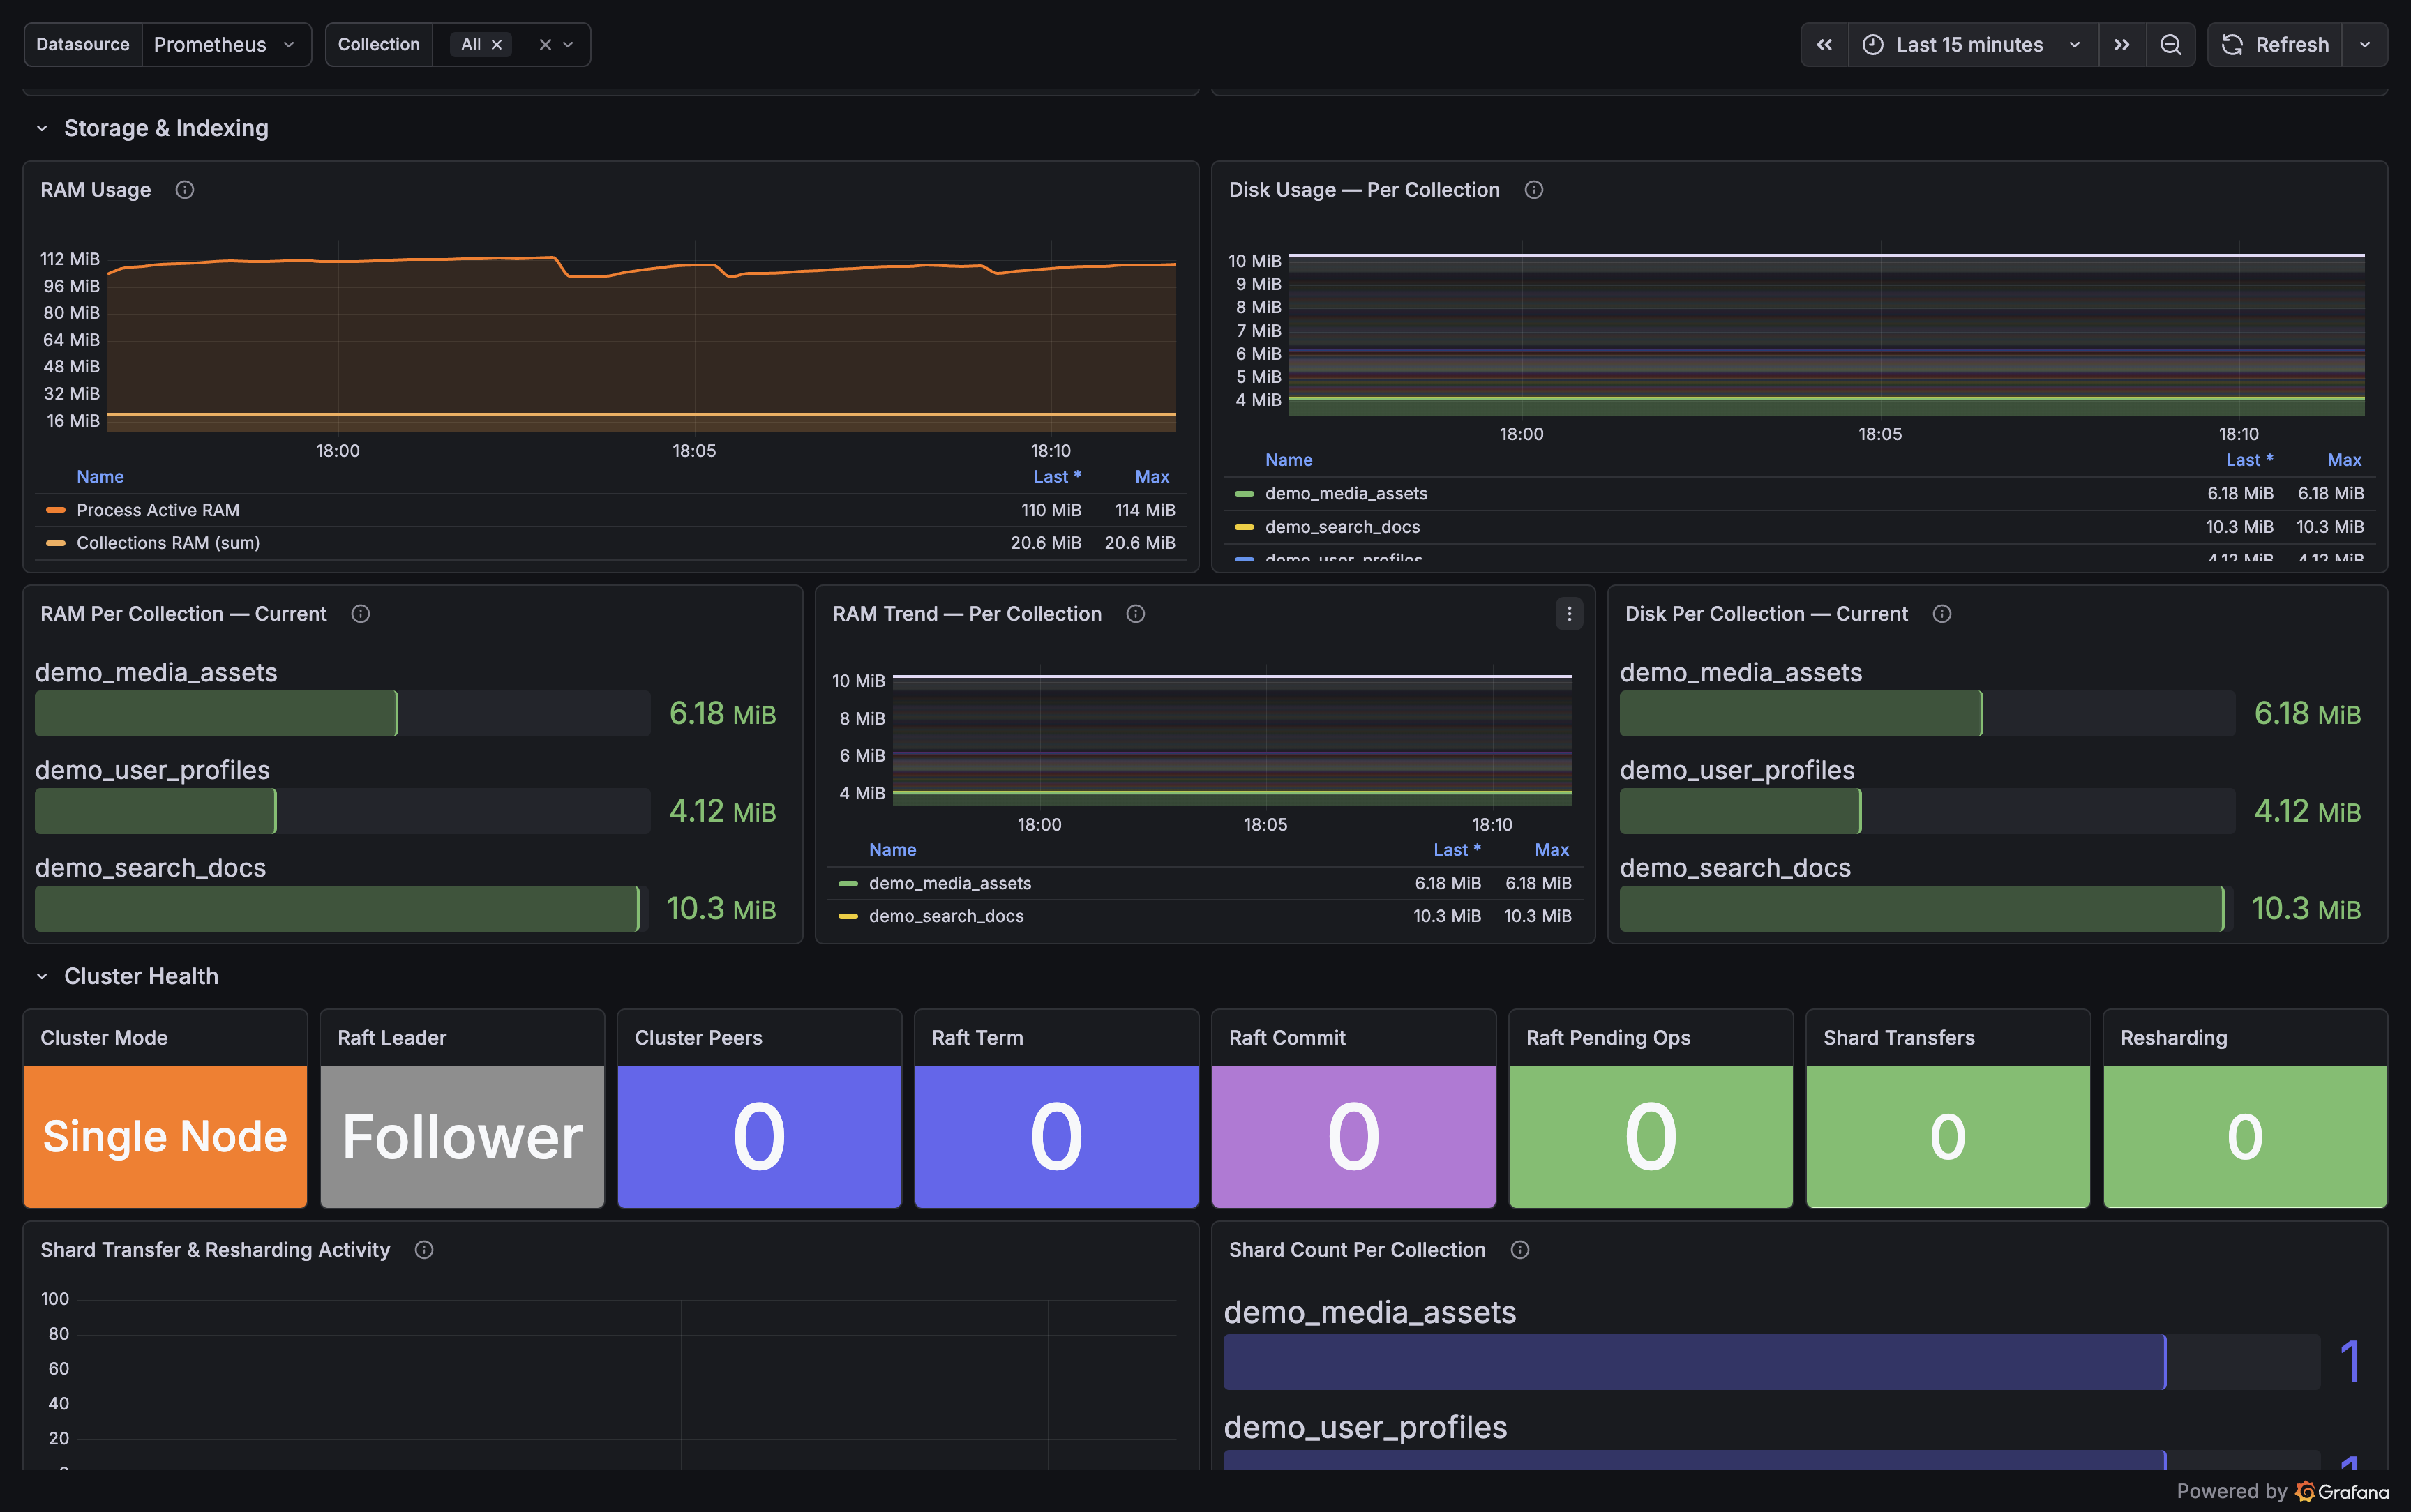
Open Grafana at http://localhost:3000 (admin / admin). Dashboard auto-provisioned.
git clone https://github.com/baselhusam/qdrant_exporter
cd qdrant_exporter

# Spin up Qdrant + exporter + Prometheus + Grafana
docker compose --profile fullstack up -d

# Or attach to an existing Qdrant on localhost:6333
docker compose --profile monitoring up -d
Grafana
localhost:3000
admin / admin
Prometheus
localhost:9090
Exporter
localhost:9153/metrics
Qdrant
localhost:6333
fullstack only
pip install qdrant-exporter

# Start with a config file
qdrant-exporter --config qdrant-exporter.yaml

# Or point at Qdrant via env var
QDRANT_EXPORTER_QDRANT__NODES='[{"url":"http://localhost:6333"}]' \
  qdrant-exporter
Requires Python 3.11+. Prometheus scrape target: http://localhost:9153/metrics